The New York City office market is one of the busiest in the world, in terms of both leasing and sales activity. Manhattan is one of the priciest business districts out there, home to a high density of multinational corporations, international organizations, financial juggernauts, and tech giants. Businesses of all kinds are attracted to the city, from small startups renting a coworking space in the hip Flatiron District, to massive corporations taking over entire buildings in Hudson Yards or the Plaza District.
The constantly growing demand and intense competition for office space in NYC has pushed rents and sale prices higher and higher over the years. In some parts of the city, office asking rents can go well above $100 per square foot, while trophy office assets can fetch exorbitant prices. Take Google’s $2.4 billion purchase of Chelsea Market in 2018 or the Coca-Cola Building, which changed hands twice in 2019, each time for more than $900 million. That’s just how high the appetite for office property is in New York City, even after the retreat of Chinese investors in recent years.
As we move into 2020, we wanted to take a look back and get an overview of the office sales activity in New York City over the past decade. We used Rolling Sales data from the NYC DOF to look at all the office building sales to close in the city from 2010 up to 2020, and tracked the evolution in the yearly number of sales, the total sales volume and the median sale price, both at the city and borough levels. Below, we’re offering an overview of the office sales activity in NYC throughout the past decade, along with some highlights for each borough in part.
The Median Sale Price for NYC Office Assets Jumped 112% Since 2010
The New York City office market had quite a fruitful year in 2019, recording 213 major office building sales worth a total of over $10 billion in dollar volume – a 30% rise in sales volume compared to 2018. The total sales volume recorded in 2019 was 69% higher than the volume recorded back in 2010, and the number of sales was also significantly higher.
Over the past 10 years, 2,262 office sales closed in New York City, for a combined sales volume of over $78 billion. The median sale price for office assets rose 112%, from $1,8 million in 2010 to $4 million in 2019 – a net gain of more than $2 million. This means that the median sale price for NYC office properties was $2.8 million in the 10 years between 2010 and 2020.
Looking at the sales data, it seems like 2014 and 2015 were the busiest years for the NYC office market. The market had its best year of the decade in terms of total dollar volume in 2014, when more than $10.5 billion worth of office properties changed hands. The next year, the dollar volume decreased to $8.8 billion, but the number of sales reached a decade-high record of 302 sales.
The median sale price for office assets trading in NYC was $4 million in 2019, the same number that was recorded in 2014. This goes to show that 2019 was one of the best years for office sales in the city, despite a lack of Chinese investors snagging trophy office assets in Manhattan. It remains to be seen whether investors can keep the momentum going in 2020.
2019 Was Manhattan’s Best Year in Terms of Office Sales Activity
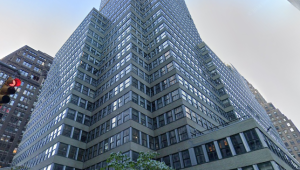
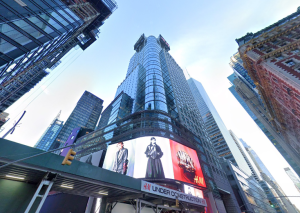
Zooming in on Manhattan, it becomes clear that 2019 was a staple year in terms of office sales activity in the borough. A number of 67 office building sales closed last year, for a dollar volume of $9.4 billion – the highest volume since 2014, when $9.7 billion worth of office assets traded hands. The market also recorded a 30% increase in the total sales volume in 2019 compared to 2018, signaling that investor interest is stronger than ever.
In terms of median sale prices, 2019 was Manhattan’s best year of the past decade. The median sale price for office buildings in the borough rose 17% compared to 2018, and 120% compared to 2010, reaching $55 million in 2019. The numbers show that office assets in Manhattan are pricier than ever, and investors are still willing to fork over massive amounts for the chance to own a trophy office building in the borough.
Brooklyn Office Prices Are Higher Than Ever, Yet Sales Activity is Dwindling
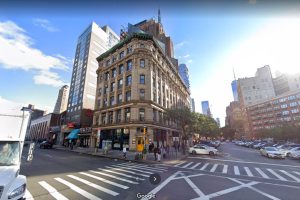
Moving across the bridge to Brooklyn, which has experienced a boom in both commercial and residential development in recent years, the difference between Manhattan and the other boroughs becomes very obvious. The borough saw a steady growth in office sales activity since 2010, up until 2017, when it recorded its best year, with $855 million in dollar volume. However, activity slowed down significantly during 2018, when Brooklyn closed the year with 48 office sales and $285 million in sales volume. The following year saw office sales pick up a bit of steam, and 2019 recorded 47 sales and $373 million in dollar volume for the borough.
Even though 2019 seems like not such a great year for Brooklyn when compared to 2017, it was still significantly busier than previous years. The total sales volume rose 320% compared to 2010, while the median sale price was 193% higher in 2019 than it was a decade ago. The median sale price for Brooklyn office assets went from $905,000 in 2010 to $2.65 million in 2019, which shows that, while the number of sales and the total dollar volume are well below 2017 levels, office prices are on the rise in the borough.
The Median Sale Price for Queens Office Assets Tripled From 2010 to 2019
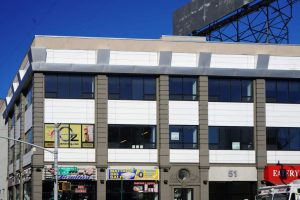
Queens has been experiencing a very steady and constant evolution in terms of office sales activity over the past decade. The borough has gradually drawn more and more interest from investors, and Amazon’s near-land in Long Island City has only strengthened that interest in 2019. While the number of sales has gone down over the years, the total sales volume and median sale price have been on a rise. The yearly sales volume was 263% higher in 2019 than it was in 2010, and the median sale price for Queens office assets jumped from $775,000 to $3 million in 2019.
The only anomaly standing out in the visual above is 2012, when the office sales volume suddenly spiked to $677 million. This spike is largely due to the $481 million sale of 1 Court Square, a 53-story office tower in Long Island City. The tower, located at 25-01 Jackson Avenue, changed hands in July 2012, when SL Green sold the property to David Werner Real Estate. The sale came down to a little over $350 per square foot, which pushed the total dollar volume a lot higher than any other time in the past 10 years.
Bronx Office Sales Have Record Year in 2019, With $208M in Total Volume
Interest in the Bronx office market has intensified significantly since 2010, on all levels. The number of sales more than tripled over the past decade, while the yearly sales volume saw a massive growth, from $10.9 million in 2010 to $208 million in 2019. The past year proved the most fruitful in the past 10 years, as the borough recorded 30 office transactions and the highest dollar volume in a decade.
The median sale price for office properties changing hands in the Bronx recorded a 27% growth over the past decade, going from $1.1 million in 2010 to $1.4 million in 2019. The past year marked a decrease in the median sale price compared to 2018 and 2017, yet with the number of sales and the total volume on the rise, it’s safe to say the market is experiencing a positive streak.
Staten Island Records $309M in Office Sales From 2010 to 2019
The Staten Island office market isn’t as active as the other boroughs, but it has also seen increased investor interest over the past 10 years. Though prices have seen ups and downs over the years, the office sales activity in the borough remained healthy and constant. The one year that stands out is 2018, when the yearly sales volume jumped to $81 million, and the median sale price climbed to $1 million. That was due to a major office sale that closed in March 2018 at 1 Edgewater Street; the Class B office building dubbed Edgewater Plaza sold for $47.2 million, a sale that pushed the total volume and the median sale price much higher than any other year that we looked at.
Methodology
Data source: Rolling Sales Data, the NYC Department of Finance, January 2010 through December 2019. We removed all office transactions with undisclosed prices, as well as transactions with sale prices below $1,000.